
Lower technology spend, same operating capability
We reduce cloud, data platform, licensing, and AI inference costs on systems already in production - through engineering changes measured against usage
+ AI INFERENCE COST
+ LICENCE RATIONALIZATION


Reduction of Spend That Nobody Decided On
Why technology spend grows without anyone deciding to spend more
No single decision creates the problem. Cloud usage rises as data accumulates. Licences are added as teams grow and never removed as they change. Automations multiply, each running on a schedule nobody revisits. AI workflows expand from one model call to a dozen. Every increase is small, individually justified, and invisible against the total.

Finding the waste is the easy part - most organizations recover only a fraction of what an audit identifies, because identifying a cost and changing the system that produces it are different kinds of work. Kynera does the second: query patterns restructured, retention policies applied, model routing rebuilt, integrations consolidated. Savings are verified against a measured baseline.
Cost Optimization Services
Cost Optimization Services
AI & LLM Cost Reduction

Model selection right-sized per task, retrieval and prompt chains restructured, caching and batching applied. Inference cost falls without output quality being traded away for it.
Cloud Cost Optimization
Instance sizing, idle resources, storage tiers, and commitment coverage brought in line with actual consumption rather than with capacity provisioned for a peak that never arrives.
Data & Storage Optimization
Query patterns, redundant pipelines, refresh frequency, and retention policies reviewed against what reporting actually requires. Compute and storage stop scaling faster than the data does.
SaaS & Licence Rationalization
Subscriptions mapped against real usage: inactive seats, tools duplicating each other's function, and renewals that pass unreviewed because nobody owns the calendar.
Automation & Integration Spend Reduction
The running cost of workflows and integrations measured per execution. Scenarios built years ago continue consuming budget long after anyone stopped watching them.
Cost Visibility & Ongoing Monitoring
A measured baseline with alerting on drift, so spend stays visible as usage grows and the reductions achieved do not quietly reverse.
Three cost domains, three different mechanics
Technology spend accumulates differently in each layer, and the same reduction method does not apply across them.
AI and Inference Spend
Prices per token keep falling. Bills keep rising.
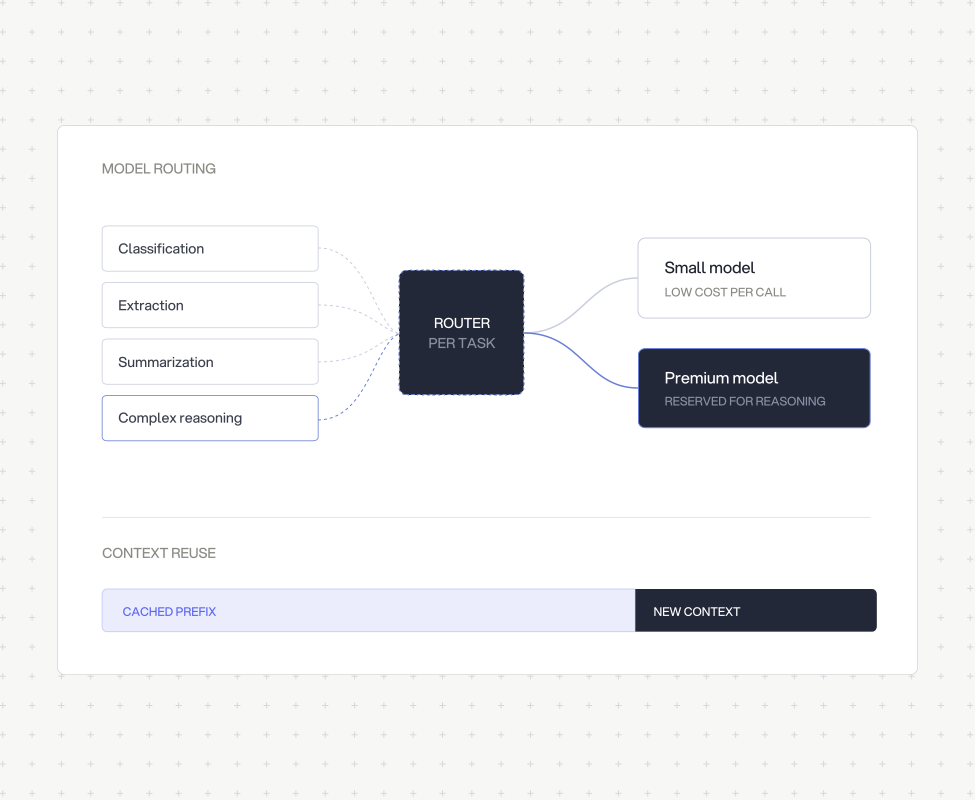
The driver is volume, not pricing. A single query is one model call; an agentic workflow that reasons, calls tools, and self-corrects can be twenty. Retrieval pushes whole documents into context, and multi-turn sessions resend the full history each time.
Most of that spend is structural: classification running on premium reasoning models, system prompts resent uncached, retrieved context arriving in full where a fraction would answer. The work is model routing, prompt caching, retrieval compression, and output limits — with quality benchmarked before and after, since a cheaper system that answers worse is not an optimization.
Cloud and Data Platform Spend
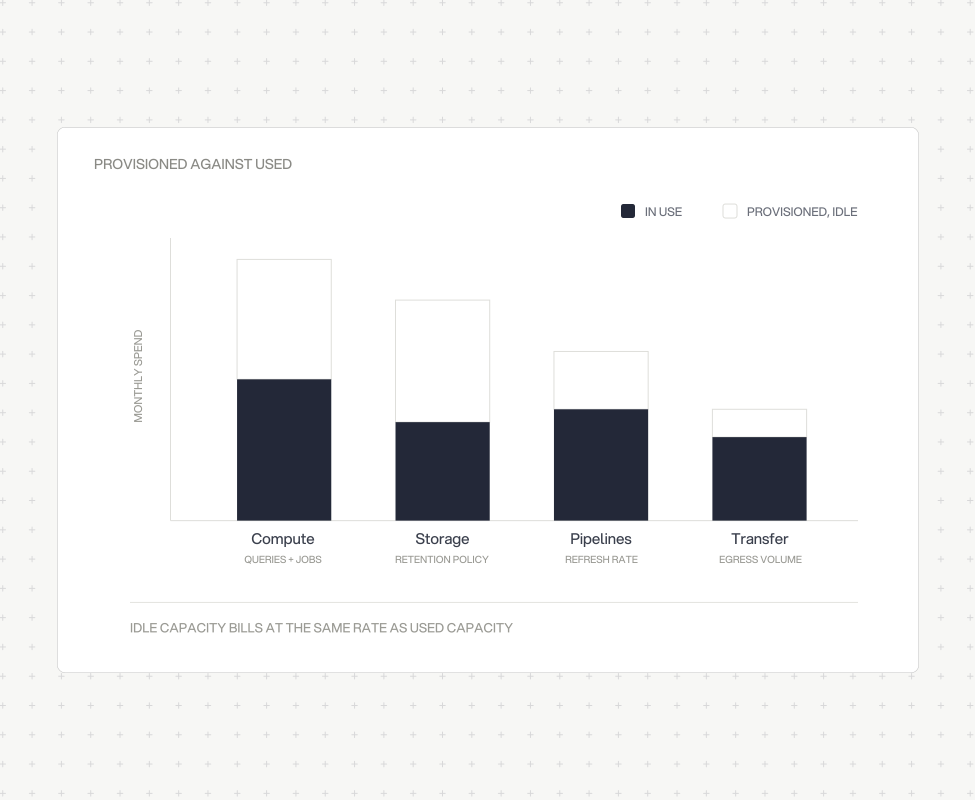
Infrastructure sized for a peak that has not occurred.
Cloud and warehouse costs grow with data volume, but rarely in proportion to it. Instances are provisioned against projected load and never revisited. Pipelines refresh hourly where the business reads the report weekly. Full table rebuilds run where incremental updates would serve. Historical data sits in premium storage tiers years after anyone last queried it.
None of this is visible on an invoice, which reports totals rather than causes. Establishing which queries, jobs, and retention policies drive the line items is the actual work, the changes that follow are usually straightforward once the drivers are known.
Software and Licence Spend
The stack accumulates faster than anyone removes from it.
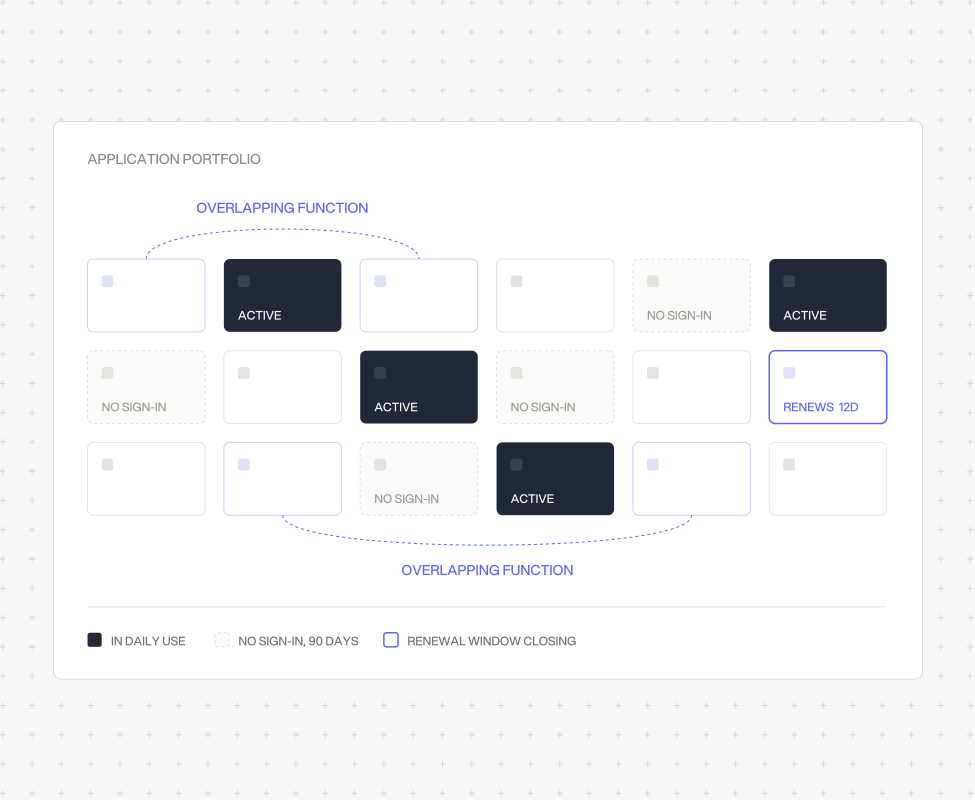
Small businesses commonly run dozens of applications; mid-market organizations run into the hundreds. Tools are bought by departments independently, with different renewal dates and overlapping functions. Seats provisioned for employees who changed roles remain active. Auto-renewal windows close before anyone reviews whether the tool is still used.
The reduction is rarely dramatic per tool and substantial in aggregate. It requires connecting three sources most organizations never combine: identity logs showing who actually signs in, financial records showing what is actually paid, and a renewal calendar showing when the decision windows open.
How a cost optimization engagement runs
Savings are modelled before work begins and verified against a baseline afterwards
Spend Discovery & Baseline
Establishing what is actually being paid across cloud, platform, licensing, automation, and inference - combining billing data, usage logs, and identity records.
Driver Analysis
Identifying what produces each line item: which queries, which jobs, which seats, which workflows. Totals become causes.
Reduction Plan & Modelling
Each proposed change modelled for savings, effort, and risk to capability. Work is sequenced by return, and changes that trade quality for cost are excluded.
Implementation
Changes applied - configurations, query restructuring, routing, retention, licence consolidation - with quality benchmarked before and after where output is affected.
Verification Against Baseline
Actual spend compared against the pre-engagement baseline across a full billing cycle. Modelled savings are confirmed or corrected.
Guardrails & Monitoring
Alerting on spend drift, documented ownership, and review points so the reductions hold as usage grows.
Lower Run Rate on Existing Systems
Spend falls on infrastructure and tooling already in place, without functionality being removed or usage restricted.
AI Economics That Survive Scale
Inference cost per task drops, which is what determines whether an AI system remains viable as volume grows rather than being shut down.
Visible Cost Drivers
Spend is traceable to the queries, jobs, and workflows that produce it, rather than appearing as a monthly total nobody can explain.
A Stack That Matches Actual Use
Licences, tools, and capacity reflect what the organization uses today, not what it planned for two renewal cycles ago.
Budget Released for Capability
Money recovered from waste funds the work that produces return, rather than being lost to a permanent overhead nobody chose.
Reductions That Hold
Baselines and drift alerting mean spend stays where it was brought, instead of reverting within two quarters.
What changes after cost optimization
How much can we realistically expect to save?
It depends entirely on what is being spent and where. Cloud and data platform environments that have never been reviewed typically hold more recoverable cost than ones already managed actively; AI systems built quickly on premium models usually hold the most.
Rather than quoting a percentage, the discovery stage produces a measured baseline and a plan where each change carries its own modelled saving, so that the number is established before the work is committed to.
Will this reduce what our systems can do?
No. Most available reduction comes from work the systems were never asked to do: resources sitting idle, data nobody queries, seats nobody signs into, and model calls larger than the task requires.
Where a change could affect output - model routing in particular - quality is benchmarked before and after, and any change that trades accuracy for cost is excluded.
as a small company, is our spend even large enough to optimize?
Often yes, and the proportions are similar regardless of scale. Small businesses commonly run dozens of applications and mid-market organizations run into the hundreds, with the same patterns of unused seats, overlapping tools, and unreviewed renewals. A hundred-person company paying for tools nobody uses has the same structural problem as a large one, with fewer zeros.
The practical threshold is not company size but whether spend has been reviewed against actual usage and opportunities at least once.
How do you charge for this - is it a share of savings?
Fixed scope and fixed fee. Percentage-of-savings arrangements create an incentive to find cuts rather than to find the right ones, and they make the engagement harder to end cleanly. The plan produced at stage three shows modelled savings against the fee, so the economics are visible before implementation begins.
Do we have to change platforms or vendors?
Usually not. Most reduction comes from configuration, usage, and structure within what is already in place - instance sizing, query patterns, retention policies, model routing, licence counts. Where consolidating two overlapping tools genuinely produces the saving, that is presented as an option with its migration cost included rather than assumed to be worth it.
How do you know the AI system still works after the changes?
Quality is measured alongside cost. A benchmark set of representative queries with expected outputs is established before any routing or caching change, and re-run afterwards. A lower bill on a system that answers worse is not a saving - it moves the cost from the invoice to support load and user trust, where it is harder to see and harder to reverse.
What stops the costs from climbing back?
Nothing structural, unless it is built in. Spend grows because each individual increase is small and nobody owns the total. The final stage establishes a baseline with alerting on drift, documented ownership for each cost area, and defined review points; Including renewal dates, which are the single most common place savings quietly reverse.
Let's establish whether Kynera is the right fit for your organization
