How Data Is Eroding Businesses' Profit Margins
How Data Is Eroding Businesses' Profit Margins
Every company with a few years of history has some version of this: pipelines nobody fully understands anymore, three slightly different definitions of "customer," a weekly ritual where two analysts spend half a day reconciling numbers before a meeting, and a running joke about which dashboard to trust. Everyone agrees it's a problem. Nobody can say what it's costing, in the one unit that actually moves budget decisions: money. So it sits below every other funded initiative, forever, because "our data infrastructure is messy" loses every prioritization meeting against a line item with an actual number attached.
Technical debt got taken seriously in software engineering the moment someone started expressing it in sprint-hours and dollars instead of vibes. Data debt deserves the same treatment. It's calculable — not perfectly, but well enough to compare against the cost of fixing it, which is the only comparison that actually gets something funded.
Data debt shows up as more than one cost
Each of these costs is measured differently, sits in a different budget line, and gets caught by a different person — which is exactly why they never get added together. A finance lead sees the reconciliation hours. An engineering lead sees the firefighting. Nobody sees all of it at once, so nobody ever treats it as a single number worth funding against. The five that follow are the ones that show up most consistently, across the widest range of businesses.
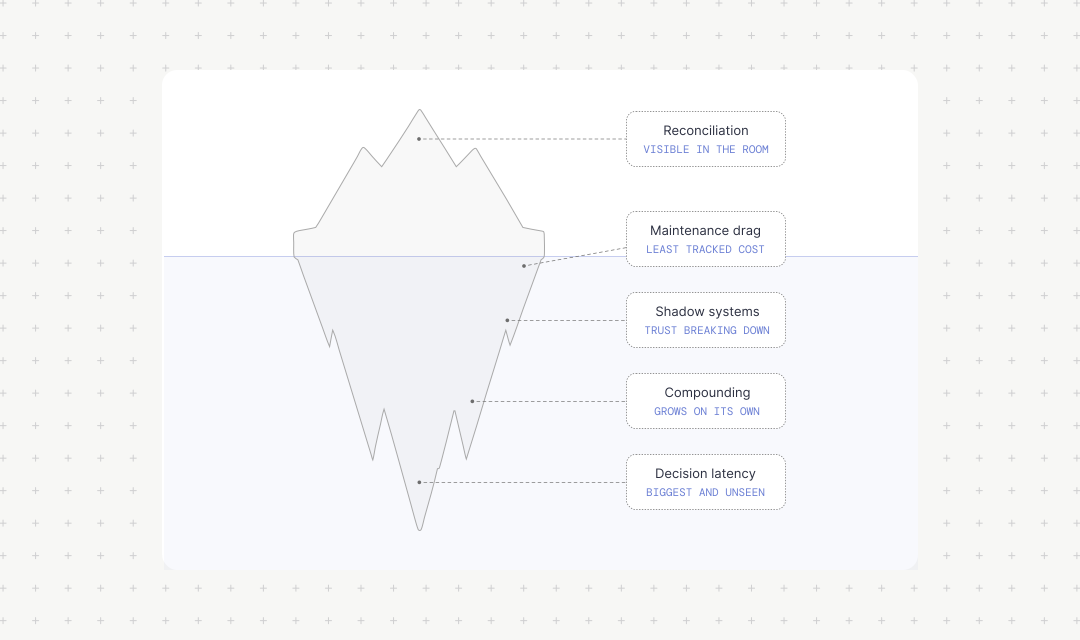
1. Reconciliation cost
The Tuesday before the board deck: finance and analytics on a call, walking line by line through two reports that should match and don't. Someone finds it — a return that hits one system and not the other, a currency conversion applied twice — and the deck goes out three hours late. Nobody logs those three hours anywhere. They become "the usual pre-board scramble."
Reconciliation cost = (hours reconciling per week) × (fully loaded hourly cost) × (52 weeks)
Run that for one recurring ritual and it's already a five-figure number. Most companies run several — a board deck, a weekly ops review, a quarterly close — each quietly costing someone a morning.
2. Maintenance drag
How much of the data engineering team's time goes into babysitting fragile pipelines, patching broken jobs, and answering "why does this number look wrong" tickets, instead of building anything new.
A data engineer's actual week, in a company carrying real data debt, looks less like building and more like triage: a pipeline broke overnight and needs patching before the morning refresh, a stakeholder wants to know why last week's numbers don't match this week's for no obvious reason, a script someone wrote two years ago and left the company needs to be reverse-engineered before anyone can safely touch it.
Maintenance drag = (fraction of engineering time on firefighting) × (total fully loaded engineering cost)
In most companies carrying real data debt, this is the largest number in the whole calculation — and the furthest from any budget conversation, because "the data team is busy" reads as normal, not as money leaving the building.
3. Decision latency cost
This one matters most and gets counted least, because it never appears as a cost. It appears as a decision: a pricing change, a purchase order, a headcount plan, made three weeks later than it should have been — or made on the numbers everyone had, even though everyone in the room suspected those numbers were a little wrong. Nobody writes "lost $160K because we weren't sure which inventory figure was real" anywhere. It becomes part of the outcome, indistinguishable from an ordinary result.
Decision latency cost = (key decisions/year where the data is in question) × (value at stake per decision) × (share of value lost to delay or error)
Even a handful of decisions a year, at real dollar stakes, tends to dwarf every other line on this list — the kind of cost that never gets budgeted against because it never gets named.uarterly close — each quietly costing someone a morning.
4. Compounding cost
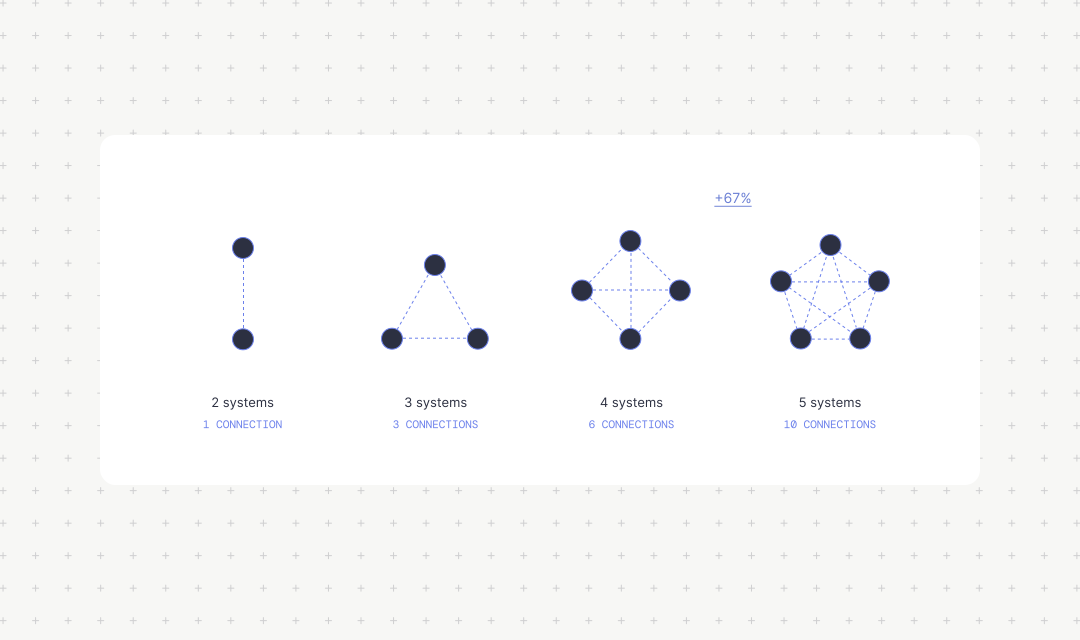
Unlike the first three, this one isn't a dollar figure on its own — it's the mechanism that makes them grow every year without a single new hire. A company running CRM and accounting has one connection that needs to agree. Add an ERP on the production side: three. Add a warehouse or logistics platform: not four — six. Every new system doesn't add one relationship to manage. It adds a relationship to everything already running.
Integration points = n × (n − 1) / 2, where n is the number of systems holding operational data
A company adding a fifth system doesn't see its reconciliation load rise by a fifth — it roughly doubles. Data debt that felt manageable three years ago feels unmanageable today, even where headcount barely moved.
5. Shadow-system cost
It rarely looks like a problem. It looks like diligence. A regional sales manager stops trusting the CRM's pipeline figure, so she keeps her own spreadsheet, updated by hand every Friday. An ops lead doesn't fully trust the inventory count coming out of the WMS, so he keeps a private tally "just in case." Neither is being difficult — both are doing the rational thing once the source of truth has let them down before.
Shadow-system cost = (hours/week on personal tracking sheets) × (number of managers keeping them) × (fully loaded hourly cost) × (52 weeks)
That's only the time spent maintaining the sheets. The dollar side is real but modest next to what the formula can't capture: the meeting where three people bring three different numbers, and the hour goes to arguing whose sheet is right instead of deciding anything.
The number nobody adds up
Individually, each of these looks survivable — a known inefficiency, the cost of doing business. Add the five together for a mid-sized company running lean on data infrastructure, and the total routinely clears half a million dollars a year, before a single missed opportunity is counted. Nobody adds them together because nobody owns all five. Reconciliation sits in finance's budget. Maintenance drag sits in engineering's headcount. Decision latency never gets a line at all — it's buried inside results that already happened.
Why this stays unfunded anyway
Data debt doesn't stay unfixed because fixing it is expensive. It stays unfixed because the cost of not fixing it is invisible by design — split across departments, none of which sees the total, none of which is accountable for it. Finance sees analyst hours. Engineering sees headcount consumed by maintenance instead of roadmap work. Nobody sees the full number leaking out of a company that would fund a fix without a second meeting, if that number ever landed on one desk.
How we solve it at Kynera
The fix is never the same twice — sometimes the systems don't synchronize, sometimes the pipelines underneath are the actual problem, sometimes the data agrees fine and nobody's built anything that turns agreement into a faster decision.
This is the layer Kynera works at. Every cost on this list is, underneath the mechanics, the same problem: money spent maintaining the business instead of growing it — erosion that never shows up on a P&L as "data debt," but shows up everywhere as margin. Recovering it starts with data, because automation and decision systems only perform as well as the data underneath them agrees with itself — whether that means synchronizing sources that already exist, rebuilding the architecture underneath them, or building systems that turn agreement into faster decisions.
If any of the five costs above sound familiar, that's usually reason enough to have the conversation.
Where to look first
Three questions tend to surface most of the picture before any formal diagnostic starts.
- How many people, across how many departments, lose real hours each week making numbers agree before anyone trusts them?
- How many decisions in the last year got delayed, or made on a shrug, because the data was in dispute?
- How many "backup" spreadsheets exist that nobody officially owns but everybody quietly relies on?
The honest answers are usually enough to know whether this belongs on next quarter's roadmap — or whether it already is one, and nobody's put a number on it yet.

.svg)
.svg)
.svg)